Supervised Machine Learning
Supervised machine learning refers to a category of machine learning in which we train models using data with explicit labels or targets. By providing both input examples (features) and the correct output labels for those examples, the model “learns” how to map new, unseen inputs to the proper outputs. By leveraging labeled datasets, supervised machine learning algorithms can learn underlying patterns and relationships and then generalize these insights when making predictions on new, previously unseen data. This process can be broadly classified into two main types:
Classification
In a classification task, the goal is to predict discrete class labels or categories for each input. Examples include predicting whether an email is “spam” or “not spam,” identifying an image as containing a “cat,” “dog,” or “bird,” or diagnosing a medical condition as “positive” or “negative.” The defining aspect is that the outputs belong to a finite set of distinct categories.
Regression
Regression, on the other hand, focuses on predicting continuous or numerical values. Typical examples include estimating a house’s price based on its features, forecasting stock market prices, or predicting the temperature for the next day. The key difference is that the outputs can take on any value within a range, rather than being limited to discrete labels.
Decision Trees
Predicting Diabetes Onset
Over several years, a hospital’s endocrinology department gathered detailed health information on a large cohort of patients—tracking factors such as weight, blood glucose levels, and family medical history. Some of these patients eventually developed Type 2 Diabetes, while others did not. The primary objective is to analyze this data to determine which factors most reliably predict who is at high risk of developing diabetes within the next five years.
Features to include:
Age
Body Mass Index (BMI)
Blood Pressure
Fasting Glucose Levels
Insulin Levels
Family History of Diabetes (e.g., whether a parent or sibling has diabetes)
Physical Activity Level (categorical: “High,” “Moderate,” “Low”)
Dietary Habits (e.g., proportion of high-sugar or high-fiber foods)
Target - Whether the patient developed Type 2 Diabetes within five years (Yes or No).
Goal - Build a decision tree model that uses these attributes (age, BMI, blood pressure, etc.) to predict if a new patient is likely to develop diabetes in the next five years.
How Decision Trees Work
To build the decision tree, you split your training data into nodes, trying to create nodes that each contain only—or mostly—instances of a single category (in this case, “Developed Diabetes” vs. “Did Not Develop Diabetes”). The first step is to determine which feature best separates the data into these pure nodes.
One way to measure the effectiveness of a split is by calculating entropy, which reflects how “pure” (or certain) each node is:
A node with all samples in the same category has entropy = 0 (completely pure).
A node with an even spread of categories has higher entropy (less pure).
When you specify criterion=” entropy” in a decision tree, the algorithm computes information gain—the reduction in entropy after splitting on a particular feature. The feature that yields the greatest drop in entropy (highest information gain) is used for the split. By choosing criterion=” entropy”, each node is split in a way that most effectively reduces uncertainty. This can offer valuable insights, especially if you want to compare different splitting methods (such as Gini impurity vs. entropy) to see how they affect your tree’s structure and predictive power.
Decision trees combine simplicity with effectiveness (useful for classification and regression tasks), making them an ideal tool for a variety of contexts, including predictive modeling. The models naturally handle both numerical features (BMI, glucose, blood pressure) and categorical features (family history, activity level), and can reveal which high-risk factors are most predictive of diabetes onset—helping guide patient education, lifestyle interventions, and early screening programs.
Unsupervised Machine Learning
Unsupervised learning is a branch of machine learning in which models learn independently to uncover patterns or structures in data without any predefined labels or targets. Instead of learning from examples paired with the “correct” answers (as in supervised learning), the model explores the underlying structure in the data to identify similarities, differences, or other informative relationships. Through these methods, unsupervised learning helps uncover hidden structures, relationships, and patterns in data that would otherwise remain undiscovered without labeled examples. Some of the most common techniques in unsupervised learning include:
Dimension Reduction
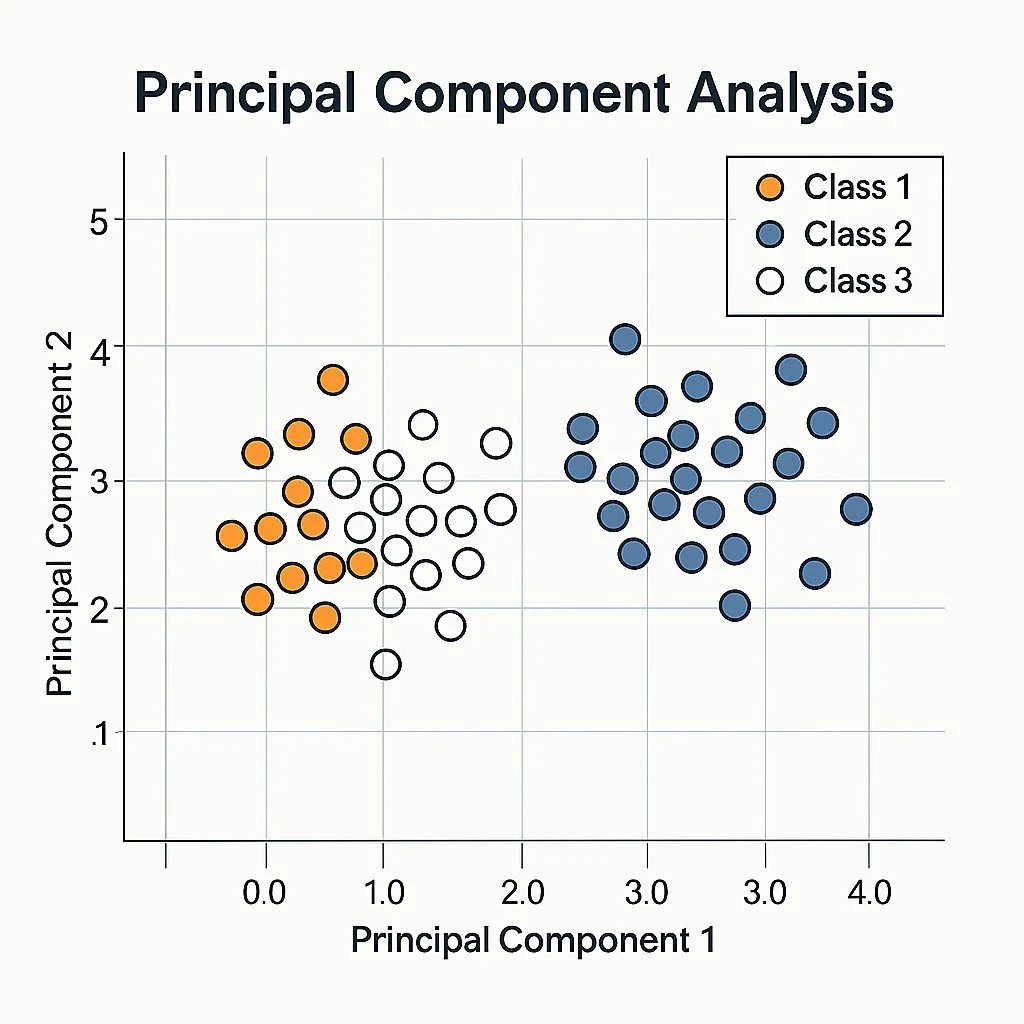
This involves reducing the number of variables (features) in a dataset while retaining as much information as possible. Methods such as Principal Component Analysis (PCA) and t-SNE are examples of dimensionality reduction. They help simplify complex datasets, speed up model training, and reveal hidden patterns that might be obscured by higher-dimensional data.
Density Estimation
Density estimation aims to determine the probability distribution or “shape” of the data. Techniques such as Kernel Density Estimation (KDE) help model the probability density function of a dataset, providing insights about where data points are concentrated and where they are sparse.
Market Basket Analysis
Often used in retail and e-commerce, market basket analysis involves mining transactional data to identify associations between products or items that are frequently purchased together. This technique can guide promotional strategies, store layout optimizations, and targeted recommendations.
Clustering
Clustering groups data points into clusters such that items within a cluster are more similar to each other than they are to items in other clusters. Common clustering algorithms include k-means, DBSCAN, and hierarchical clustering. Clustering is widely used in customer segmentation, anomaly detection, and image grouping, among other applications.